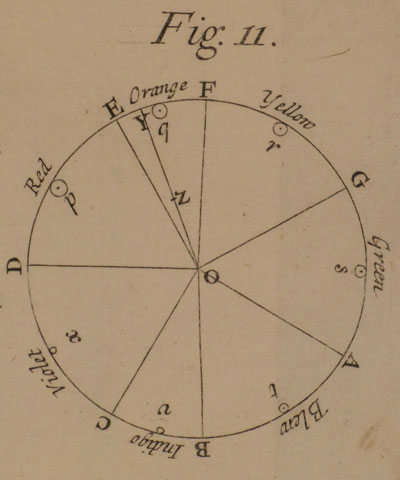
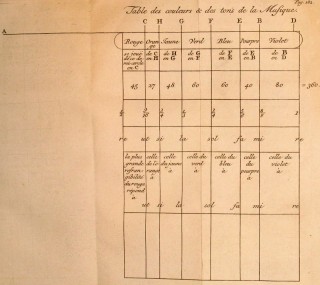
The link between visual art – color, shape, texture – and music – harmony, rhythm, dynamics, etc. – has a long history. In his book “Opticks: or, A Treatise of the Reflections, Refractions, Inflexions and Colours of Light,” Isaac Newton described sound’s propagation through air to establish a new dimension in the study of music. He described the correlations he perceived between the color spectrum and the musical scale and suggested that the spectrum of seven colors was governed by the same ratios underlying the diatonic scale.
Later, Voltaire would make Newton’s optical theories accessible to a wider public in his “Elemens de la philosophie de Neuton” by illustrating Newton’s mathematical foundation for music’s 7-note diatonic scale (a scale containing only notes proper to the prevailing key without chromatic alteration) and the corresponding colors of the spectrum.
Inspired by Newton’s color studies Alexander Scriabin invented the “Clavier a Lumieres” a keyboard with keys mapped to his synesthetic system, based on his so-called synesthetic experiences. This was later refuted by numerous synesthesia researchers who realized that the re-ordering of the colors in the circle of fifths revealed a close connection to Newton’s color theory, not Scriabin’s synesthesia.
Other artists like Wassily Kadinsky, Oskar Fischinger and Norman McLaren have also attempted to visualize music.
Today, visual representations of audio can are often purely informational, described and illustrated by grids, waveforms, and linear graphs (found in popular software like Protools, Ableton Live, Logic, etc). while music visualizations found on computers, packaged with the operating system (eg. iTunes visualizer) are wholly decorative. In the realm of “information art & design,” creative coders like Aaron Koblin, Ben Fry and Casey Raes access programming environments (Processing, openFrameworks, etc.) to create languages that are capable of expressing music in new data-driven expressions and visualizations.

View in “Arrangement View” in Ableton Live, showing graphical visualization of waveforms, sections, measures, etc.
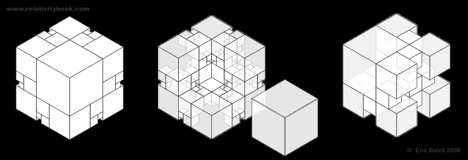
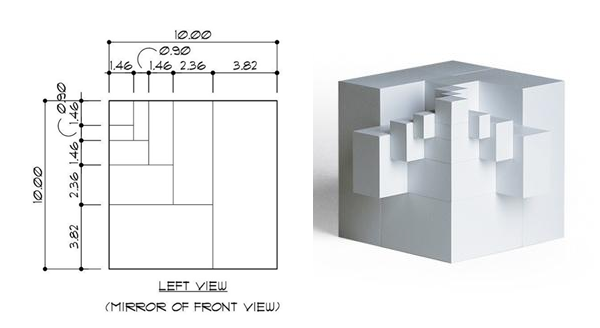
My “case study” involves a consideration of these “visual music” precedents to which I will be adding my own interpretation. Creating an analog representation of the abstract quality of music is an unsolved “puzzle”. In my experiment I am not aiming to solve the problem of how music can be visualized, rather I will explore alternative methods of visualization. Departing from the golden section (or ratio), my model will consist of a cube, divided into sections following the geometric relationships expressed in the golden ratio. This will allow for the model to be able to translate into several different sculptures / models.

Additional configurations of the cube, based on the geometric principles of the golden ratio/section.
Using video projection, and mapping onto the cube, I will attempt to create several visual representations of analysis of J.S. Bach’s work, specifically the first fugue of his “The Art of the Fugue.” A first test (of the cube, but on a smaller scale) will be presented on 10/16, using a computer running Resolume Avenue, Syphon, MadMapper, and controlled using TouchOSC on a wireless network (see diagram). MIDI (Musical Instrument Digital Interface) of the four voices of the fugue can be translated into visuals and will be used to represent the voices.


